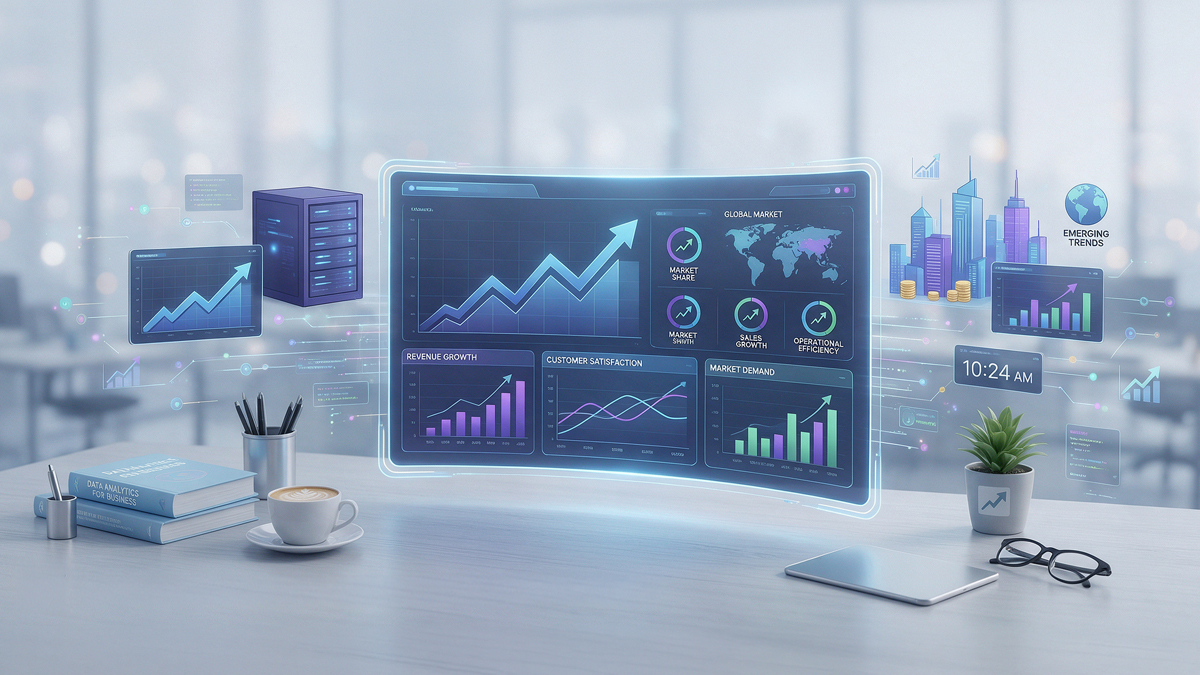
How to Identify Business Trends Using Data Analytics
Every business generates data, but very few use it to see what is coming next. Some regions see sales drop, while others experience unexpected spikes in activity. Customers change their purchasing patterns without notice, and fast-evolving markets outpace most companies’ ability to respond. If businesses do not monitor developments as they happen, they will only learn about them after the opportunity or threat has passed.
This is where business data analytics for business comes into play. Using information on sales, customer behavior, and other metrics, it creates a picture of a business's future without relying on guesses. The tool gives you clear answers to questions about product popularity and which consumer segments are losing interest in a business and its offerings.
This guide explains how to track business developments using data analytics tools, what data to gather, how to turn it into decisions, and the obstacles businesses usually face.
How Data Analytics Helps Identify Business Trends
Business data analytics works best when applied consistently, not just quarterly. Used properly, it helps you:
- Understand customer behavior and preferences by tracking what people buy, how often, and why they stop
- Identify sales and revenue patterns across products, regions, and time periods
- Monitor market and industry trends, so you know how your business compares to competitors
- Detect operational inefficiencies before they affect delivery times or costs
- Identify emerging business opportunities that would otherwise stay hidden in raw numbers
- Use historical data to recognize patterns and predict what is likely to happen next
Brickwork India's data analytics and visualization services are built around this kind of ongoing tracking, turning scattered reports into dashboards your team can check without needing a data science background.
How to Use Data for Better Business Decisions
Data-driven decision-making requires the right information, presented in a way that prompts action.
A quick look at how the two approaches compare:
| Aspect |
Traditional Decision-Making |
Data-Driven Decision-Making |
| Basis of Decisions |
Experience and intuition |
Verified data and analytics |
| Speed of Response |
Slower, reactive |
Faster, proactive |
| Risk Level |
Higher, based on assumptions |
Lower, backed by evidence |
| Accuracy |
Inconsistent |
Consistently measurable |
| Scalability |
Difficult to replicate |
Easy to scale across teams |
| Trend Detection |
Often missed until visible in results |
Identified early through patterns |
Collect the Right Business Data
To get useful analysis, you must provide individualized inputs to the relevant business operations. In most cases, five categories are the most important inputs for the decision-making process.
- Sales and revenue data
- Customer data, including demographics and purchase history
- Marketing data, such as campaign performance and channel results
- Operational data, covering production, logistics, and service delivery
- Financial data, from cash flow to cost per unit
Getting this right takes proper data management practices, and many companies choose to work with a professional data analyst rather than trying to build this expertise in-house from scratch.
Analyze Data to Identify Patterns
Once the data is collected, look for movement over time rather than single data points — that's the core of data analytics for business.
- Compare historical performance month over month and year over year
- Identify growth and decline patterns before they become obvious in your bottom line
- Segment customers and products to see which groups are driving results
- Track key performance indicators (KPIs) that are specific to your business, not generic industry averages
This is the core of data-driven decision-making in business: patterns tell you what is coming; single numbers only tell you what already happened.
Visualize Business Trends
Numbers on a spreadsheet rarely change anyone's mind in a meeting. Visual formats do:
- Dashboards that refresh continuously
- Charts and graphs that make comparisons easy to explain
- KPI reports built around the metrics leadership cares about
- Interactive data visualization tools that let teams drill into specific regions, products, or time periods
Good visualization also helps teams streamline operations once they identify trends, because everyone works from the same picture instead of arguing over whose numbers are right.
Turning Insights Into Data-Driven Business Decisions
Spotting a trend is only half the job. The other half is doing something with it.
- Translate analytics findings into actions your teams can use immediately
- Prioritize opportunities based on data rather than gut feeling
- Forecast potential outcomes before committing budget or resources
- Measure the impact of decisions once they are implemented
- Continuously monitor and refine strategies as conditions change
Companies that view this as a continual process rather than a one-time procedure tend to make far more powerful data-driven business choices over time. The distinction between responding to a trend and forecasting one often comes down to whether data-driven business decisions are part of daily operations or only happen in the event of a disaster.
Common Challenges in Using Data Analytics for Business
Even well-resourced teams run into the same obstacles when applying data analytics for business:
- Poor data quality, which undermines every conclusion built on top of it
- Data silos, where different departments keep information that never gets combined
- Lack of analytics expertise in-house to interpret what the numbers mean
- Too much data with limited actionable insight, leaving teams overwhelmed rather than informed
- Difficulty integrating multiple data sources into one usable view
- A lack of a data culture, where decisions still get made on instinct despite the data available
None of these are permanent problems. Most get solved with the right process and the right people, not with more software.
Why Brickwork India for Data Analytics and Visualization
When your company has the necessary information but lacks the time or expertise to analyze it, Brickwork India can help. Our team helps business organizations with:
- Experienced data analytics for business professionals who understand both the tools and the business context behind the numbers
- Business-focused analytics solutions built around your industry, not generic templates
- Data visualization and dashboard development that keeps reporting simple to read
- Actionable business insights instead of raw spreadsheets nobody has time to interpret
- Data-driven decision support for teams at every level, from operations to leadership
- Scalable analytics capabilities that grow as your data needs grow
- Customized reporting and visualization built around the KPIs your business tracks
- A long-term analytics partnership rather than a one-off project
Whether you need ongoing data analytics for business or support with a single analytics project, our research and consulting services can help identify the trends your competitors are still missing. Because data-driven decision-making depends on having the right numbers at the right time, starting earlier often pays off. Contact Brickwork India to discuss your business needs, or request a free quote to get started.
Internal Links Used
| Anchor Text |
Links To |
URL |
| data analytics and visualization services |
Service page |
https://www.brickworkindia.com/services/data-analytics-and-visualization |
| research and consulting services |
Service page |
https://www.brickworkindia.com/services/research-support-services |
| data management practices |
Blog |
https://www.brickworkindia.com/blog/the-basics-of-data-management |
| professional data analyst |
Blog |
https://www.brickworkindia.com/blog/data-analysis-virtual-assistant-vs-professional-data-analyst |
| streamline business operations |
Blog |
https://www.brickworkindia.com/blog/streamline-business-operations-virtual-support |
| Contact Brickwork India |
Contact page |
https://www.brickworkindia.com/contact-us |
| Request a free quote |
Contact/Enquiry page |
https://www.brickworkindia.com/enquiry |
Posts you might also like...
6 Oct 2026
Business Support
Which Companies Provide Reliable Research Support Services for U.S. Businesses?
U.S. businesses today are making decisions faster than ever, mainly about which markets to enter, which competitors to watch, which customers to prioritize, and which investments are worth the risk. Behind every one of those decisions sits a mountain of research: numbers to verify, industries to track,
companies to profile, and data to make sense of. Doing all these well, and doing it consistently, is harder than it looks.
25 Sep, 2026
Business Support
7 Benefits of Supply Chain Outsourcing for Growing Businesses
Explore 7 Key Benefits of Supply Chain Outsourcing, from cost savings and improved efficiency to greater flexibility and access to specialized expertise.
25 Sep 2026
Business Support
How Data Analytics Helps Businesses Make Better Decisions
Learn how Data Analytics helps Businesses make informed decisions, identify trends, improve efficiency, reduce risks, and uncover new growth opportunities.